[leap_dropcap style=”style-1″]A[/leap_dropcap]lors que les dispositions de la loi pour la transition énergétique relatives à la mise à disposition de données par les gestionnaires de réseaux de distribution (GRD) d’électricité et de gaz ne sont pas encore entrées en application, les acteurs de l’électricité, les administrations et les collectivités locales multiplient les initiatives autour de l’Open Data. De nombreuses données relatives à la production et à la consommation d’énergie sont déjà disponibles, à des mailles géographiques variables.
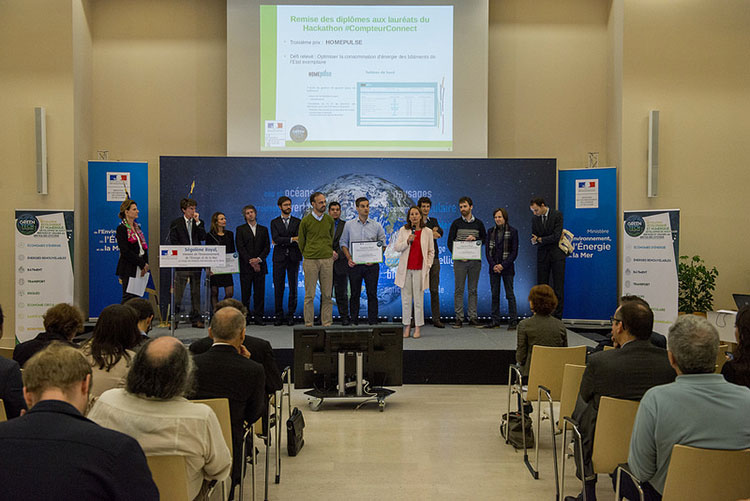 Remise des prix du Hackathon Compteur Connect – Crédit photo : Ministère de l’Ecologie en CC sur Flickr[1]
[leap_gap height=”20px” ]
[leap_quote style=”single-quotes” bg_color=”” icon_size=”” icon_color=”” padding_right=”” padding_left=”” ]L’ouverture de ces données est susceptible de générer de nombreux bénéfices sur les plans environnemental, économique et social. Des entreprises pourraient développer et proposer, grâce à ces données, des services et produits innovants, et ce à toutes les échelles utiles : particuliers, entreprises, quartiers, villes.[/leap_quote]
[leap_gap height=”20px” ]
Ce diagnostic, posé en avril 2015 par le Contrat de filière éco-industrie efficacité énergétique[2] n’est pas resté lettre morte. En un an, le paysage des données relatives au secteur de l’énergie est profondément transformé.
L’Observatoire de l’énergie électrique, RTE et Enedis (ex ERDF) publient depuis quelques années toute une série de données sur :
[leap_ul][leap_li icon=”arrow-circle-right” iconcolor=”#a2b731″]la consommation d’électricité,[/leap_li][leap_li icon=”arrow-circle-right” iconcolor=”#a2b731″]la production d’électricité par filière,[/leap_li][leap_li icon=”arrow-circle-right” iconcolor=”#a2b731″]les échanges commerciaux aux frontières,[/leap_li][leap_li icon=”arrow-circle-right” iconcolor=”#a2b731″]les émissions de CO2 par kWh d’électricité produite en France,[/leap_li][leap_li icon=”arrow-circle-right” iconcolor=”#a2b731″]les flux interrégionaux.[/leap_li][/leap_ul]
Avec l’Open Data, il ne s’agit plus seulement de publier des données mais de favoriser leur réutilisation : au travers de licences et au travers de plateformes, qui permettent de télécharger les données dans divers formats ouverts et interopérables, et de les visualiser. Il s’agit aussi de rendre les données « activables » au travers d’API (interfaces de programmation) pour permettre aux acteurs de s’en emparer et concevoir une nouvelle génération de services.
Ouverture progressive des données d’Enedis
En avril 2015, Enedis mettait en ligne sur son site un premier jeu de données, très attendu : le bilan électrique (production / consommation / injection sur le réseau Enedis).
Lors du Climate Change Challenge (C3), organisé en novembre 2015, dans le cadre de la COP21, Enedis mit à la disposition des participants, et au-delà, à tous les utilisateurs de data.gouv.fr, une série de jeux de données relatifs à la consommation, à la puissance installée et au parc des installations de production raccordées au réseau.
16 jeux de données sont aujourd’hui disponibles, en téléchargement et par le biais d’API, sur la plateforme Open Data d’Enedis.
[leap_gap height=”20px” ]
[leap_quote style=”single-quotes” bg_color=”” icon_size=”” icon_color=”” padding_right=”” padding_left=”” ]Par cette mise à disposition, Enedis (…) souhaite permettre à tout un chacun de disposer des données et informations dont il a besoin pour ses démarches, actions et engagements au service de la transition énergétique. Les publics intéressés sont nombreux : acteurs du marché de l’électricité, clients et producteurs, collectivités locales, acteurs de l’innovation, citoyens[3].[/leap_quote]
[leap_gap height=”20px” ]
La plateforme open data d’Enedis permet de suivre l’usage qui est fait des jeux de données. Avec 23 771 téléchargements, le Bilan Électrique au pas journalier arrive en tête des jeux de données les plus « populaires », suivi par le Parc des installations de production raccordées sur le réseau Enedis par région (1 965 téléchargements), le bilan électrique au pas demi-heure (1 703) et le bilan électrique – puissance installée (1 681 téléchargements) [4].
… ainsi que chez RTE
RTE avait entrepris depuis de nombreuses années de diffuser sur son site des données, à l’échelle régionale et nationale sur la consommation d’électricité, la production d’électricité par filière, les Echanges commerciaux aux frontières, les émissions de CO2 par kWh d’électricité produite en France, la Consommation, production et flux interrégionaux.
La démarche open data de RTE, amorcée elle aussi à l’occasion du Climate Change Challenge (C3) s’est traduite début 2016 par l’ouverture d’une plateforme Open Data. Les 21 jeux de données qui y sont disponibles couvrent un très large éventail de natures et à des mailles géographiques variables : la consommation, la production par filière, les échanges d’électricité en Europe, les bilans électriques régionaux, … L’origine de l’électricité consommée est également détaillée ainsi que les pays de destination des exportations.
On peut également y suivre les jeux de données les plus sollicitées : la production annuelle par filière (570 téléchargements), la consommation annuelle finale régionale d’électricité (563 téléchargements), les parcs annuels de production éolien et solaire (468).
De nombreuses ressources disponibles sur Data.gouv.fr
La plateforme nationale Data.gouv.fr accueille les données d’un grand nombre d’acteurs : outre les17 jeux de données de RTE[5] et les 13 proposés par Enedis[6], cette plateforme permet d’accéder aux 28 jeux de données rassemblés par le Service statistique du Ministère de l’écologie, du développement durable et de l’énergie (MEDDE) dans le cadre de la base Pégase (Pétrole, gaz, électricité et autres statistiques de l’énergie) et à la base des diagnostics de performance énergétique de l’Ademe[7] ou encore à la Consommation et production d’énergie dans les Industries agroalimentaires et dans les exploitations agricoles (ministère de l’Agriculture, de l’Agroalimentaire et de la Forêt).
Un certain nombre d’acteurs locaux ou régionaux (comme Morbihan énergies[8] ou le GIP Bretagne Environnement) et de services déconcentrés de l’état (Loiret[9], Haute-Savoie[10]) s’appuient sur data.gouv.fr pour publier les données qu’ils détiennent. 83 jeux de données relatifs à l’éolien[11] et 28 relatifs aux bornes de recharge[12] y sont d’ores déjà disponibles.
Le hackathon Compteur Connect, organisé par le Ministère de l’Écologie en association avec Think Smartgrids, a permis de mettre en lumière un certain nombre de jeux de données disponibles sur data.gouv.fr, comme :
[leap_ul][leap_li icon=”arrow-circle-right” iconcolor=”#a2b731″]les étiquettes énergétiques des bâtiments municipaux (Mairie de Paris),[/leap_li][leap_li icon=”arrow-circle-right” iconcolor=”#a2b731″]les Consommations énergétiques du patrimoine bâti,[/leap_li][leap_li icon=”arrow-circle-right” iconcolor=”#a2b731″]des ouvrages d’eau et des ouvrages d’assainissement (agglomération de Lorient),[/leap_li][leap_li icon=”arrow-circle-right” iconcolor=”#a2b731″]la Production photovoltaïque sur les bâtiments communaux (commune de Saint-Malo),[/leap_li][leap_li icon=”arrow-circle-right” iconcolor=”#a2b731″]les Chèques habitat durable (département de Saône-et-Loire),[/leap_li][leap_li icon=”arrow-circle-right” iconcolor=”#a2b731″]les déperditions de chaleur des habitations (Grand Paris Seine Ouest),[/leap_li][leap_li icon=”arrow-circle-right” iconcolor=”#a2b731″]le Recensement de l’éolien par région,[/leap_li][leap_li icon=”arrow-circle-right” iconcolor=”#a2b731″]les Chaufferies bois et réseaux de chaleur,[/leap_li][leap_li icon=”arrow-circle-right” iconcolor=”#a2b731″]les installations géothermiques et[/leap_li][leap_li icon=”arrow-circle-right” iconcolor=”#a2b731″]les unités de méthanisation (Pays de la Loire)[13].[/leap_li][/leap_ul]
Des jeux de données relatifs à l’énergie font désormais leur apparition sur les portails open data des régions, des villes et des Métropoles. La Région PACA, déjà en pointe avec la base de données Energ’Air (maintenue par AirPaca et l’Observatoire Régional de l’Energie, du Climat et de l’Air) donne désormais accès, sur son portail, à la production et à la consommation annuelles d’énergie par commune, par communauté de communes et par département[14].
L’offre de données disponibles aux échelles des villes ou des régions est encore balbutiante. Cette situation devrait évoluer avec la publication prochaine du décret d’application de l’article 179 de la loi Transition Énergétique (TECV). Cet article impose aux GRD d’électricité et de gaz de fournir aux collectivités les « données économiques nécessaires à l’élaboration des dispositions réglementaires définissant les dispositifs de soutien à la production de certaines formes d’énergie et aux économies d’énergie ». Il prévoit, en outre, que ces données soient publiées en open data. Le décret, en cours d’élaboration, précisera les modalités de cette mise à disposition (nature et finesse des données) et veillera à la protection de la vie privée des personnes, en rendant impossible leur identification.
[leap_gap height=”50px” ]
ITEMS International pour Think Smartgrids
[leap_gap height=”80px” ]
Jeux de données disponibles sur la plateforme Open data d’Enedis
[leap_ul][leap_li icon=”arrow-circle-right” iconcolor=”#a2b731″]Consommation journalière par catégorie client[/leap_li][leap_li icon=”arrow-circle-right” iconcolor=”#a2b731″]Bilan Électrique – Puissance installée des sites de production raccordés au réseau Enedis par région et par filière (photovoltaïque et éolien)[/leap_li][leap_li icon=”arrow-circle-right” iconcolor=”#a2b731″]Flexibilités participant au MA ou à NEBEF par région (Ces flexibilités correspondent aux capacités de production ou d’effacement participant au Mécanisme d’Ajustement et aux capacités d’effacement valorisées sur les marchés de l’énergie (NEBEF)[/leap_li][leap_li icon=”arrow-circle-right” iconcolor=”#a2b731″]Flexibilités participant au MA ou à NEBEF au périmètre d’ Enedis[/leap_li][leap_li icon=”arrow-circle-right” iconcolor=”#a2b731″]Bilan Électrique au pas demi-heure (volumes d’énergie injectés, soutirés, produits ou consommés à la maille Enedis sur une période de temps donnée au pas demi-heure[/leap_li][leap_li icon=”arrow-circle-right” iconcolor=”#a2b731″]Bilan Électrique au pas journalier (volumes d’énergie injectés, soutirés, produits ou consommés à la maille Enedis sur une période de temps donnée au pas jour)[/leap_li][leap_li icon=”arrow-circle-right” iconcolor=”#a2b731″]Parc des installations de production raccordées sur le réseau Enedis par tranche de puissance[/leap_li][leap_li icon=”arrow-circle-right” iconcolor=”#a2b731″]Parc des installations de production raccordées sur le réseau Enedis par région[/leap_li][leap_li icon=”arrow-circle-right” iconcolor=”#a2b731″]Répartition de la file d’attente des demandes de raccordement en cours de traitement au réseau de distribution géré par Enedis, en nombre et en puissance[/leap_li][leap_li icon=”arrow-circle-right” iconcolor=”#a2b731″]Qualité de fourniture (durée annuelle moyenne de coupure pour les clients alimentés en basse tension)[/leap_li][leap_li icon=”arrow-circle-right” iconcolor=”#a2b731″]Répartition de la file d’attente producteur par tranche de puissance (volume des demandes de raccordement production au réseau de distribution géré par Enedis en fonction de la filière, en nombre et en puissance)[/leap_li][leap_li icon=”arrow-circle-right” iconcolor=”#a2b731″]Historique du parc des installations de production raccordées sur le réseau Enedis[/leap_li][leap_li icon=”arrow-circle-right” iconcolor=”#a2b731″]Coefficients des profils (valeurs de 10 profils nationaux construits par Enedis en vue d’établir des bilans réglementaires d’énergie)[/leap_li][leap_li icon=”arrow-circle-right” iconcolor=”#a2b731″]Coefficients de pertes techniques (fer et Joule) et non techniques (dysfonctionnement de comptage, fraudes…)[/leap_li][/leap_ul]
[leap_gap height=”20px” ]
-> Accès à la plateforme Enedis
[leap_gap height=”20px” ]
https://data.erdf.fr/
Jeux de données disponibles sur la plateforme Open Data de RTE
[leap_ul][leap_li icon=”arrow-circle-right” iconcolor=”#a2b731″]Facteurs de charge mensuel et taux de couverture mensuels éoliens et solaires (janvier 2012 à avril 2016)[/leap_li][leap_li icon=”arrow-circle-right” iconcolor=”#a2b731″]Extrêmes journaliers des flux commerciaux (janvier 2012 à avril 2016) (Valeurs minimales et maximales journalières en puissance du bilan des flux commerciaux sur l’ensemble des frontières contextualisées par la température moyenne journalière)[/leap_li][leap_li icon=”arrow-circle-right” iconcolor=”#a2b731″]Equilibre mensuel production = consommation brute (janvier 2007 à avril 2016)[/leap_li][leap_li icon=”arrow-circle-right” iconcolor=”#a2b731″]Historique de la réalisation de l’équilibre mensuel production/consommation (GWh) en fonction de la consommation brute, du solde des échanges physiques avec l’étranger, des soutirages dus au pompage[/leap_li][leap_li icon=”arrow-circle-right” iconcolor=”#a2b731″]Pic journalier de la consommation brute d’électricité (janvier 2012 à avril 2016)[/leap_li][leap_li icon=”arrow-circle-right” iconcolor=”#a2b731″]Historique journalier de la puissance maximale (GW) nécessaire pour couvrir les pics de la consommation brute française[/leap_li][leap_li icon=”arrow-circle-right” iconcolor=”#a2b731″]Scénario “Référence” du bilan prévisionnel 2015 (Modélisation des besoins de puissance moyenne (MW) par heure et par secteur/usage à l’horizon 2019-2020[/leap_li][leap_li icon=”arrow-circle-right” iconcolor=”#a2b731″]Courbe de charge de la consommation brute d’électricité : Puissance moyenne (MW) consommée par tranche de 30 minutes au périmètre de la France continentale. (janvier 2008 à mars 2016)[/leap_li][leap_li icon=”arrow-circle-right” iconcolor=”#a2b731″]Courbe de charge de la production d’électricité par filière Puissance moyenne (MW) générée par tranche de 30 minutes au périmètre de la France continentale et agrégée par grande filière de production. (janvier 2013 à mars 2016)[/leap_li][leap_li icon=”arrow-circle-right” iconcolor=”#a2b731″]Imports et exports commerciaux, au pas horaire depuis 2005, entre la France et chacun des pays avec lesquels elle partage des interconnexions : Grande-Bretagne, Suisse, Italie, Espagne, zone CWE (Allemagne, Autriche, Belgique, Luxembourg, Pays-Bas)[/leap_li][leap_li icon=”arrow-circle-right” iconcolor=”#a2b731″]Volumes annuels d’électricité échangés entre responsables d’équilibre (2011 à 2015)[/leap_li][leap_li icon=”arrow-circle-right” iconcolor=”#a2b731″]Transactions commerciales annuelles (MWh) entre responsables d’équilibre (RE)[/leap_li][leap_li icon=”arrow-circle-right” iconcolor=”#a2b731″]Parc annuel de production par filière (2007 à 2015)[/leap_li][leap_li icon=”arrow-circle-right” iconcolor=”#a2b731″]Production annuelle française d’électricité (TWh) par filière et par territoire (2013 à 2015)[/leap_li][leap_li icon=”arrow-circle-right” iconcolor=”#a2b731″]Consommation annuelle brute d’électricité (2001 à 2015), avec et sans correction de l’aléa climatique[/leap_li][leap_li icon=”arrow-circle-right” iconcolor=”#a2b731″]Consommation annuelle finale régionale d’électricité (2006 à 2014)[/leap_li][leap_li icon=”arrow-circle-right” iconcolor=”#a2b731″]Consommation finale (hors pertes) annuelle d’électricité (GWh), corrigée de l’aléa climatique, par région administrative[/leap_li][leap_li icon=”arrow-circle-right” iconcolor=”#a2b731″]Evolution annuelle des longueurs de circuits du réseau de transport d’électricité (2011 à 2015)[/leap_li][leap_li icon=”arrow-circle-right” iconcolor=”#a2b731″]Longueurs annuelles de circuits et files de pylônes du réseau de transport d’électricité (2011 à 2015)[/leap_li][leap_li icon=”arrow-circle-right” iconcolor=”#a2b731″]Parcs annuels de production éolien et solaire (MW) par région administrative et au niveau national (2001 à 2015)[/leap_li][leap_li icon=”arrow-circle-right” iconcolor=”#a2b731″]Consommation annuelle finale française d’électricité par typologie de consommateurs en 2015[/leap_li][leap_li icon=”arrow-circle-right” iconcolor=”#a2b731″]Pic annuel de la consommation brute d’électricité (2001 à 2015)[/leap_li][leap_li icon=”arrow-circle-right” iconcolor=”#a2b731″]Volumes mensuels d’électricité échangés : zoom sur la bourse EPEX SPOT (2014 à 2015)[/leap_li][leap_li icon=”arrow-circle-right” iconcolor=”#a2b731″]Volumes mensuels d’électricité (MWh) échangés entre responsables d’équilibre (RE) sur la bourse EPEX SPOT, en France, la veille pour livraison le lendemain (J-1)[/leap_li][leap_li icon=”arrow-circle-right” iconcolor=”#a2b731″]Volumes annuels d’électricité activés sur le mécanisme d’ajustement (2004 à 2015)[/leap_li][leap_li icon=”arrow-circle-right” iconcolor=”#a2b731″]Effacements journaliers sur le mécanisme d’ajustement. Historique journalier des capacités d’effacement de consommation d’électricité (MW) sur le mécanisme d’ajustement. (2013 à 2015)[/leap_li][/leap_ul]
[leap_gap height=”20px” ]
[leap_gap height=”20px” ]
Pétrole, électricité, gaz et statistiques de l’énergie (Pégase) sur data.gouv.fr
[leap_ul][leap_li icon=”arrow-circle-right” iconcolor=”#a2b731″]Prix à l’importation et à l’exportation[/leap_li][leap_li icon=”arrow-circle-right” iconcolor=”#a2b731″]Importations et exportations d’énergie de la France en millions d’euros[/leap_li][leap_li icon=”arrow-circle-right” iconcolor=”#a2b731″]Importations, productions, consommations par énergie, en Mtep[/leap_li][leap_li icon=”arrow-circle-right” iconcolor=”#a2b731″]Importations, production, consommation de coke et agglomérés en France (en milliers de tonnes)[/leap_li][leap_li icon=”arrow-circle-right” iconcolor=”#a2b731″]Importations, production, consommation de combustibles minéraux solides en France (en milliers de tonnes)[/leap_li][leap_li icon=”arrow-circle-right” iconcolor=”#a2b731″]Importations, production, consommation de charbon en France (en milliers de tonnes)[/leap_li][leap_li icon=”arrow-circle-right” iconcolor=”#a2b731″]Importations, production, consommation de pétrole brut en France (en milliers de tonnes)[/leap_li][leap_li icon=”arrow-circle-right” iconcolor=”#a2b731″]Consommation de produits pétroliers raffinés en France (en milliers de tonnes)[/leap_li][leap_li icon=”arrow-circle-right” iconcolor=”#a2b731″]Importations, production, consommation de gaz naturel en France (en GWh PCS)[/leap_li][leap_li icon=”arrow-circle-right” iconcolor=”#a2b731″]Importations, production, consommation d’électricité en France (en GWh)[/leap_li][leap_li icon=”arrow-circle-right” iconcolor=”#a2b731″]Gaz naturel, prix pour une entreprise selon l’enquête d’Eurostat, en euros hors TVA (2007-2014)[/leap_li][leap_li icon=”arrow-circle-right” iconcolor=”#a2b731″]Électricité, prix pour une entreprise selon l’enquête d’Eurostat, en euros hors TVA (2007-2014)[/leap_li][leap_li icon=”arrow-circle-right” iconcolor=”#a2b731″]Charbon, prix pour l’industrie, en euros hors TVA (2000-2013)[/leap_li][leap_li icon=”arrow-circle-right” iconcolor=”#a2b731″]Fioul lourd, prix pour une entreprise, en euros hors TVA (1983-2014)[/leap_li][leap_li icon=”arrow-circle-right” iconcolor=”#a2b731″]Gaz naturel, prix pour une entreprise, en euros hors TVA (1983-2014)[/leap_li][leap_li icon=”arrow-circle-right” iconcolor=”#a2b731″]Électricité, prix pour un industriel, tarif vert A5 option EJP, en euros hors TVA (1984-2014)[/leap_li][leap_li icon=”arrow-circle-right” iconcolor=”#a2b731″]Électricité, prix pour un industriel, tarif vert A5 option base, en euros hors TVA (1983-2014)[/leap_li][leap_li icon=”arrow-circle-right” iconcolor=”#a2b731″]Électricité, prix pour un industriel, tarif jaune, en euros hors TVA (1984-2014)[/leap_li][leap_li icon=”arrow-circle-right” iconcolor=”#a2b731″]Électricité, prix pour un professionnel, tarif bleu option heures creuses, en euros hors TVA (1983-2014)[/leap_li][leap_li icon=”arrow-circle-right” iconcolor=”#a2b731″]Électricité, prix pour un ménage selon l’enquête d’Eurostat, en euros TTC (2008-2014)[/leap_li][leap_li icon=”arrow-circle-right” iconcolor=”#a2b731″]Pégase – Bois, prix pour un ménage, en euros TTC (2003-2014)[/leap_li][leap_li icon=”arrow-circle-right” iconcolor=”#a2b731″]Chauffage urbain (vapeur), prix pour un ménage, en euros TTC (1986-2014)[/leap_li][leap_li icon=”arrow-circle-right” iconcolor=”#a2b731″]Produits pétroliers, prix pour un ménage, en euros TTC (1983-2014)[/leap_li][leap_li icon=”arrow-circle-right” iconcolor=”#a2b731″]Gaz naturel, prix pour un ménage, en euros TTC (1983-2014)[/leap_li][leap_li icon=”arrow-circle-right” iconcolor=”#a2b731″]Électricité, prix pour un ménage, tarif bleu option Tempo, en euros TTC (1995-2014)[/leap_li][leap_li icon=”arrow-circle-right” iconcolor=”#a2b731″]Électricité, prix pour un ménage, tarif bleu option heures creuses, en euros TTC (1983-2014)[/leap_li][leap_li icon=”arrow-circle-right” iconcolor=”#a2b731″]Gaz naturel, prix pour un ménage selon l’enquête d’Eurostat, en euros TTC (2008-2014)[/leap_li][leap_li icon=”arrow-circle-right” iconcolor=”#a2b731″]Item 5[/leap_li][leap_li icon=”arrow-circle-right” iconcolor=”#a2b731″]Électricité, prix pour un ménage, tarif bleu option base, en euros TTC (1983-2014)[/leap_li][/leap_ul]
[leap_gap height=”20px” ]
-> Accès à la plateforme Pégase
[leap_gap height=”80px” ]
[1] https://www.flickr.com/photos/franceecologieenergie/27275628462/
[2] http://www.entreprises.gouv.fr/files/files/directions_services/conseil-national-industrie/Contrats_de_filieres/CF-COSEI_efficacite_energetique_signe_OK.pdf
[3] https://www.etalab.gouv.fr/erdf-poursuit-son-avancee-dans-lopen-data-au-cote-detalab
[4] https://data.erdf.fr/page/accueil/
[5] https://www.data.gouv.fr/fr/organizations/reseau-de-transport-delectricite/#datasets
[6] https://www.data.gouv.fr/fr/organizations/electricite-reseau-distribution-france/#datasets
[7] https://www.data.gouv.fr/fr/organizations/ademe/#datasets
[8] https://www.data.gouv.fr/fr/organizations/morbihan-energies/#members
[9] https://www.data.gouv.fr/fr/datasets/point-du-reseau-de-transport-electrique/
[10] https://www.data.gouv.fr/fr/datasets/regimes-delectrification-en-haute-savoie/
[11] https://www.data.gouv.fr/fr/search/?q=eolien
[12] https://www.data.gouv.fr/fr/search/?q=recharge
[13] https://www.data.gouv.fr/fr/posts/compteurconnect-les-donnees-du-hackathon-sur-la-consommation-energetique/
[14] http://opendata.regionpaca.fr/donnees/detail/production-annuelle-denergie-par-commune-communaute-de-communes-et-departements-en-paca.html